As an expert in ServiceNow, I understand the importance of leveraging data to drive informed decisions and improve operational efficiency. In this blog post, I will delve into the functionality of reporting and dashboards within ServiceNow and how they can empower organizations to extract valuable insights.
One of the key features of ServiceNow is its robust reporting capabilities. With ServiceNow, users can easily create customized reports tailored to their specific needs. Whether it’s tracking key performance indicators (KPIs), analyzing incident trends, or monitoring service levels, ServiceNow’s reporting functionality provides real-time visibility into your organization’s data.
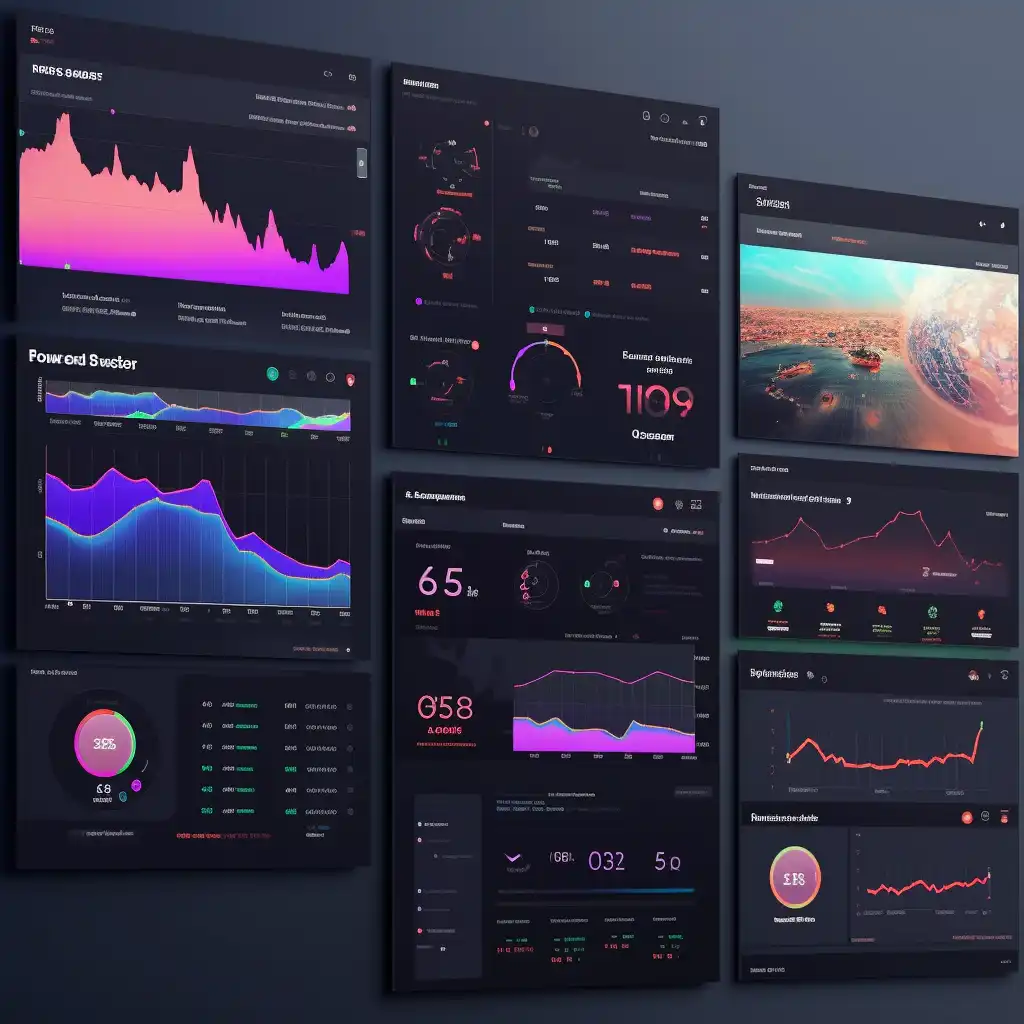
Dashboards take reporting a step further by consolidating multiple reports into a single, visually appealing interface. ServiceNow’s dashboard feature allows you to create personalized dashboards that provide a holistic view of your business metrics. By aggregating data from various sources, you can monitor performance, track progress, and identify areas for improvement at a glance.
One of the significant advantages of ServiceNow’s reporting and dashboard capabilities is the ability to access real-time data. By harnessing the power of ServiceNow’s platform, you can generate up-to-the-minute reports and dashboards, ensuring that you have the most accurate and relevant information at your fingertips. This real-time visibility enables proactive decision-making, empowering you to address potential issues promptly and seize opportunities as they arise.
ServiceNow’s reporting and dashboard functionalities are not limited to a specific department or use case. They can be applied across various business areas, such as IT service management, human resources, customer service, and more. This versatility allows organizations to gain a comprehensive view of their operations and make data-driven decisions that drive success.
Moreover, ServiceNow offers a wide range of visualization options, including charts, graphs, and widgets, to present your data in a meaningful and engaging way. By visualizing your data, you can identify trends, patterns, and outliers more easily, leading to better insights and actionable strategies.
ServiceNow’s reporting and dashboard functionalities provide organizations with the tools they need to unlock the power of their data. By leveraging real-time insights, personalized dashboards, and customizable reports, ServiceNow empowers businesses to make informed decisions, optimize operations, and drive continuous improvement. Stay ahead of the competition by harnessing the full potential of ServiceNow’s reporting and dashboard capabilities.


You must belogged in to post a comment.